
Housing affordability is often framed as a single variable problem. Prices rose. Rates rose. Therefore affordability collapsed. That explanation is emotionally satisfying but analytically weak. It treats housing like a financial instrument instead of what it is, a slow moving physical market constrained by supply, filtered through financing, and shaped by policy.
Affordability is not simply about price. It is the outcome of two forces moving in opposite directions at the same time. Constrained supply and restricted demand. Until those forces are analyzed together, most proposed solutions will misdiagnose the problem.
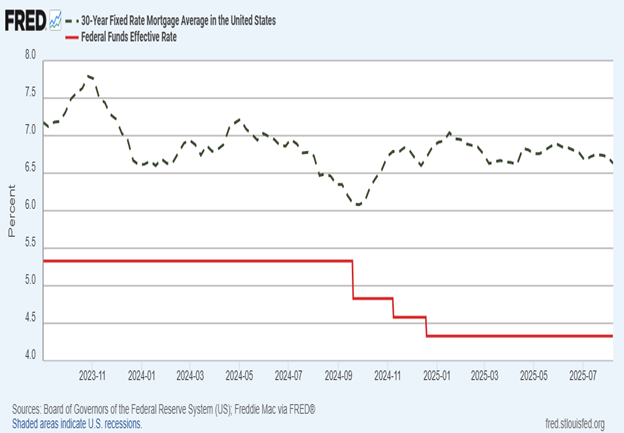
On September 17, 2025, the Federal Reserve is widely expected to cut its short-term rate. Many homeowners are holding off on refinancing, hoping that means lower mortgage rates.
But here’s the truth: Mortgage rates don’t move in lockstep with the Fed’s rate.

It’s tempting to sit on the sidelines and wait for mortgage rates to drop—but doing so could cost you more than you think.

In today’s market, sellers are feeling the pressure to make their homes stand out. According to recent data, about 20% of listings saw price reductions this spring—the highest rate in eight years. And while analysts project a modest home price decline of 1% to 1.4% nationally by the end of 2025, that doesn’t mean a price cut is your only option—or your best one.

There’s been a quiet-but-huge shift in how mortgage lenders determine if you're “creditworthy.” Very soon, lenders may use VantageScore 4.0 for loans backed by Fannie Mae and Freddie Mac—the two giants behind most conventional home loans in the U.S.
So what? Here's the so-what:

This Fourth of July, as we honor the birth of our nation, let’s remember that the American Dream—rooted in liberty and opportunity—has long been intertwined with homeownership. Owning a home isn’t just a financial milestone; it’s a symbol of stability, freedom, and pride in building a life in this great nation.

For many first-time homebuyers, the biggest hurdle to homeownership is the down payment. Fortunately, there are programs designed to help—commonly known as Down Payment Assistance (DPA).

At Williams Mortgage, we believe homeownership isn’t just about having a place to call your own—it’s a powerful tool for building long-term wealth, security, and generational opportunity. As we celebrate National Homeownership Month, let’s take a look at the numbers behind why owning a home can change lives, families, and communities.

The VA home loan program is a powerful benefit offered to eligible U.S. military service members, veterans, and some surviving spouses. Backed by the Department of Veterans Affairs, VA loans make it easier to buy, build, or refinance a home with favorable terms.

In the current climate of economic fluctuation—spurred by trade tensions, shifting inflation, and Federal Reserve policy—mortgage rates have settled in the mid‑to‑high 6% range. As of late May 2025, the average 30‑year fixed rate hovers around 6.89%, after dipping briefly to 6.76% in early May . Weekly volatility remains high: investors react quickly to bond‑market swings and tariff updates, causing lenders to adjust pricing rapidly.
Housing affordability is often framed as a single variable problem. Prices rose. Rates rose. Therefore affordability collapsed. That explanation is emotionally satisfying but analytically weak. It treats housing like a financial instrument instead of what it is, a slow moving physical market constrained by supply, filtered through financing, and shaped by policy.
Affordability is not simply about price. It is the outcome of two forces moving in opposite directions at the same time. Constrained supply and restricted demand. Until those forces are analyzed together, most proposed solutions will misdiagnose the problem.
New housing supply does not adjust quickly to changes in demand. In the Midwest especially, the problem is not speculative excess but a long term pattern of underbuilding that predates the pandemic.
According to the US Census Bureau, housing starts averaged about 1.5 million units per year from 2000 through 2006. From 2009 through 2019, they averaged closer to 1.0 million units per year.
That decade long shortfall compounds. Freddie Mac estimates the national housing supply gap exceeds three million units.
Slower appreciation in the Midwest did not prevent this deficit from forming. It only made it less visible.
At the same time, the cost of producing new housing has risen sharply. The Bureau of Labor Statistics Producer Price Index shows construction material costs rising more than 35 percent between 2020 and 2023.
Labor shortages have pushed wages higher across the construction sector, according to BLS Employment Cost Index data.
Builder financing costs have also increased materially. Federal Reserve Bank of Saint Louis data shows short term interest rates used for construction lending more than doubling between 2021 and 2023.
Regulation adds another layer. Zoning restrictions, permitting delays, and compliance requirements are often justified individually but accumulate collectively. Research from the National Association of Home Builders finds regulatory costs account for roughly 24 percent of the final price of a new single family home.
Each added requirement raises the minimum viable price point for new construction. That does not eliminate demand. It filters buyers out of the market.
Turnover also matters. The US population is aging, and older homeowners are remaining in their homes longer. Census Bureau housing tenure data shows homeowners aged sixty five and older now stay in their homes nearly twice as long as in the nineteen nineties.
Fewer listings are not a sign of weak demand. They reflect limited supply mobility. When inventory tightens, prices do not need to rise dramatically to create pressure. They only need to rise relative to alternatives.
Demand is often confused with enthusiasm. In reality, demand is purchasing power. Buyers may want homes, but higher interest rates reduce what they can borrow. Freddie Mac data shows the average thirty year mortgage rate rising from about three percent in 2021 to over seven percent in 2023.
A household that qualified for a four hundred thousand dollar loan at three percent may qualify for closer to three hundred thousand dollars at seven percent. That is not lost desire. It is lost leverage.
Affordability pressure also comes from outside the mortgage payment. Homeowners insurance premiums have risen sharply. The Insurance Information Institute reports national average premiums rising more than twenty percent between 2021 and 2023.
Property taxes eventually catch up with rising values. Census Bureau state and local tax data shows real property tax collections increasing steadily since 2020.
Both reduce effective buying power and increase monthly carrying costs.
This creates a paradox. Higher rates suppress demand but also discourage sellers from moving. Mortgage Bankers Association data shows more than eighty percent of existing homeowners hold mortgage rates below current market levels.
That locks in supply. The result is fewer transactions but continued price pressure. When rates fall, demand does not return gradually. It returns in waves. Multiple offer situations reappear quickly, especially in entry level and mid range homes. Contingencies shrink. Risk shifts back onto buyers who are already stretched.
In that environment, price becomes the rationing mechanism again.
Lower rates can improve affordability mathematically but do nothing to expand housing stock. If supply remains constrained, lower rates increase competition for the same limited number of homes. That is how lower monthly payments can coexist with higher prices.
This is not theoretical. Between 2020 and 2022, mortgage rates fell while inventory collapsed. National Association of Realtors data shows existing home inventory dropped below one million units in 2021, the lowest level on record.
Prices adjusted upward to absorb demand. Affordability did not improve. It changed form.
Conversely, higher rates reduce transaction volume but do not resolve shortages. That is why affordability feels frozen rather than corrected.
The Midwest is often described as affordable, but that is relative. Compared to coastal markets, prices are lower. Compared to incomes, the gap has still widened. Bureau of Economic Analysis data shows real wage growth in much of the Midwest lagging housing cost growth since 2019.
Insurance costs, property taxes, and construction inputs do not obey regional price myths.
Midwestern markets rely more heavily on existing housing stock than on large scale new development. When older homeowners delay selling, supply tightens quickly. The result is not explosive appreciation but persistent scarcity that raises barriers for first time buyers even when headline prices appear modest.
Investor activity is often cited as a major driver of affordability problems, but the data shows important distinctions. Recent market reports indicate investors accounted for roughly 27 to 34 percent of home purchases in 2025. That share rose largely because traditional owner occupant buying declined, not because investor buying surged.
Most of those purchases were made by small investors rather than large institutional firms. Research summarized by the Urban Institute and the Government Accountability Office shows that owners with fewer than ten properties represent the vast majority of investor purchases, while large institutional investors own only a small fraction of the single family housing stock nationally.
Political rhetoric often targets institutional buyers, but those firms account for a relatively small share of total single family home ownership and tend to be concentrated in specific regional markets rather than nationwide. That makes them highly visible but not necessarily the primary driver of national affordability trends. Framing the affordability problem around institutional investors alone risks overstating their role while understating the broader supply constraints and financing pressures that shape the market as a whole.
If affordability is framed only as a financing problem, the only lever available is interest rates. That lever is blunt and national. It does not distinguish between a housing short metro and a balanced one.
A supply and demand framing suggests a different posture.
Policies that raise construction costs should be evaluated alongside their effect on entry level supply.
Demand side assistance should be examined for how it interacts with inventory.
Turnover matters as much as new starts.
Local constraints shape outcomes more than national averages suggest.
Other countries approach housing supply differently, often with heavier public involvement or alternative zoning philosophies. The United States has historically relied more on private markets. Whether that remains sufficient is an open question, but the comparison itself is instructive.
For real estate professionals, this matters because clients experience the problem as confusion. Prices feel high. Rates feel high. Inventory feels low. Nothing seems to work. Telling buyers to wait for rates to drop is incomplete advice.
The engine of the market is the interaction between how many homes exist and how many households can bid on them at once.
Affordability will not be solved by any single variable. It is a systems problem. That does not mean it is unsolvable. It means it requires better diagnosis.
This piece is not a prescription. It is an invitation.
If you are a builder, lender, agent, planner, or policymaker, what would actually increase usable supply without simply inflating demand.
What policies quietly raise prices while claiming to protect consumers.
What assumptions persist because they feel familiar rather than because they are true.
Rates matter.
But they are not the story.
